Background
When I joined Chase Electronics in 1986 the GPR-40 was already in existence, and it had a very limited ability to output the current signal strength digitally as a stream of 8 bit ASCII characters. This was very crudely implemented, both electrically (using +5/0V logic levels) and in the software (the character output routine set an IO to the appropriate level for the current bit, then counted to 7 and moved on to the next bit – at a 2MHz clock speed this equated, very roughly to 9600 baud!) Since mobile computers were (just!) becoming a thing I was tasked with adding the hardware for a true RS232 interface and the necessary software changes to enable remote operation of all the functions.
Hardware Design
I don’t recall all the details of this (and it was implemented as a daughter board in a corner of the CPU board so doesn’t appear in the circuit diagrams), however I think it used a 16450 UART, for which the chip select line is visible as pin 14 on the address decoder (IC17) in the CPU circuit diagram. There was also a MAX232 which uses diode charge pumps to create +9/-9V from a +5V supply rail so we could have proper RS232 signalling.
Software Implementation
I designed the communication protocol to use only printable ASCII characters and based it on the pattern used by the Hayes ‘AT’ commands used in modems of the day, so it used largely commands based on 2 upper letters followed by an optional argument. Below is a quick reference listing of the original command set:
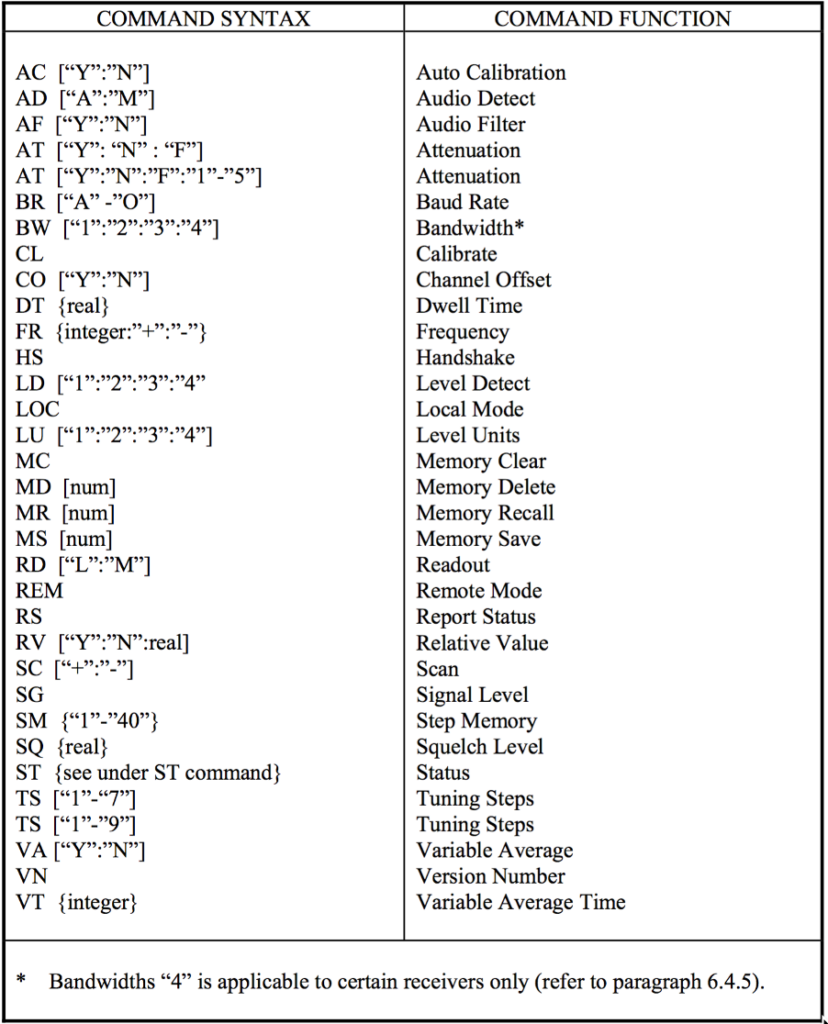
The reciever would either echo back the command or return requested data on success, and there was also a small range of error codes, “E1”, “E2”, etc.
The main data of interest was the signal level, obtained by sending the “SG” command, however I was aware that after my departure the new developers had added a facility for the signal level to be sent continuously until interrupted which allowed a higher sampling rate to be achieved.
The complete set of commands is fully documented from page 55 onwards in the Will’tek User Guide available as item 6 on the Manuals and Flyers page.
Demonstration Programs
I was also asked to create some demonstration programs to show off the remote capabilities and was given (I think, an EPSON PX-8 ( https://en.wikipedia.org/wiki/Epson_PX-8_Geneva ) as this was portable, had a 480 x 64 pixel 8 line display, a built in RS322 port and Microsoft BASIC. Since this whole field was rather new no-one could tell me what the demo should actually do so I created a few tools myself that did generate some interest.
I have a couple of screen dumps from the program – these are dated 1986 but have 25 lines of text and what looks like 320 pixels of width so I’m not sure what computer they were produced on.
This Channel Occupancy plot covers a range of frequencies in South London, including emergency services and private operators, all voice channels The columns in order show the frequency, percentage of time that a transmission is in progress and the pattern of usage over a period of about an hour. The bottom line shows the current time and date, some basic reciever information plus the current command and response from the GPR40.
The Frequency Scan shows a continuous frequency range, in this case 161.75MHz to 169.25MHz (7.5Mhz in width, at 25KHz channel spacing, so 300 channels (leaving 20 pixels on the left for the graph scale). The vertical scale is the signal strength received on each channel. This data would have been captured over the space of a couple of minutes but the display is interactive in that you can use the A/D keys to move the full height cursor line which will then report the precise signal strength at that frequency.
Of course this may all seem a bit trivial these days but it was big thing in 1986!